


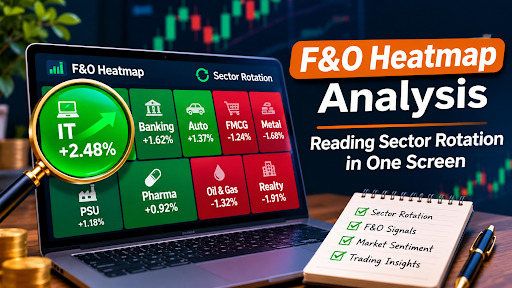
Staring at fifty different charts at the same time is a recipe for a headache. You might spot a breakout in one stock, but completely miss the fact that the entire sector is bleeding. This is how traders get blindsided. They focus so much on the branches that they forget to look at the forest. A heatmap fixes this. Everything is displayed on one screen, enabling you to see an overview of where the money is going in one place.
Decoding Size and Colour
A heatmap is a great tool that can give you an idea of what is happening by using two different visuals to show you information. The size of the block will usually indicate how much weight/market cap the sector holds. A massive block means the sector has a heavy influence on the index. The colour represents the daily price change. A deep green block means that sector is rallying hard. A dark red block means it is getting hammered.
When you apply this to future option trading, the visual cues become even more critical. You can see at a glance which sectors have the momentum to support a directional bet. If you are planning to buy a call option on a banking stock, but the entire banking sector is deep red on the heatmap, you might want to reconsider. The heatmap acts as a reality check against your individual stock picks.
The Green Block Trap
Here is the most common mistake beginners make. They see a bright green block and immediately assume it is a screaming buy signal. That is not how it works. A green block simply means the sector is up today. It does not tell you where it is going tomorrow.
Just because a sector has been green for 5 days and is currently at a resistance level doesn’t mean you should go in. It could be a profit-taking opportunity instead. Are you seeing an anomaly, or is it continuing to trend upwards? If you treat a heatmap like a traffic light, you will lose capital quickly. A heatmap is a map!
Following the Money
The real benefit of a heatmap is seeing rotation. The money does not disappear from the market; it just moves. As soon as you see the tech stocks turning red and the energy stocks turning green, you know there is a rotation happening. This enables you to switch your strategy quicker than everyone else. You can trade in the sectors that are heating up.
Here is how the heatmap compares to traditional methods:
| Feature | Standard Charts | F&O Heatmap |
|---|---|---|
| Scope | One stock at a time | Entire market in one view |
| Speed | Slow, requires searching | Instant visual recognition |
| Focus | Price history | Current sector momentum |
| Best for | Detailed analysis | Broad market context |
Getting the Right Tools
To make the most out of this data you need a trading platform that can easily integrate this into your trading terminal. If you are looking to open demat account access to a system that can really help you understand the bigger picture then look for something that provides you with. You should not have to switch between five different websites to figure out what the market is doing.
The better platforms, like HDFC Sky, embed this heatmap directly into your dashboard. You can see the rotation, understand the momentum and trade all within the same screen. This will save you time and stop you making expensive errors.
The Bottom Line
A heatmap removes any noise and shows you where the real strength is. Don’t fight the trend, use the heatmap to your advantage. Understand the size, respect the colour and never buy a stock just because it is green in it’s sector. Context is key!












Leave a Reply